Interactive Maps
Now that you have explored the powerful words and images of the Map Twins, you can dig into how demographics, businesses, schools, and many other features shape these neighborhoods. The Map Twins gave us a picture of their experiences in their areas—what was there and what was missing. The words and images shared in those interviews alongside the three maps below can help you visualize how segregation is experienced in Chicago.
The first map features basic social characteristics of the neighborhoods, the second shows the kinds of businesses in each neighborhood, and the third map sheds light on the kinds of public schools accessible to those neighborhoods. Hopefully this exploration will inspire you to look further into the Folded Map project.
These maps are a collaborative effort between Tonika and the Department of Sociology and the Urban Data Visualization Laboratory at the University of Illinois at Chicago and were funded by a grant from UIC's Institute for Policy and Civic Engagement to Tonika Johnson and Maria Krysan.
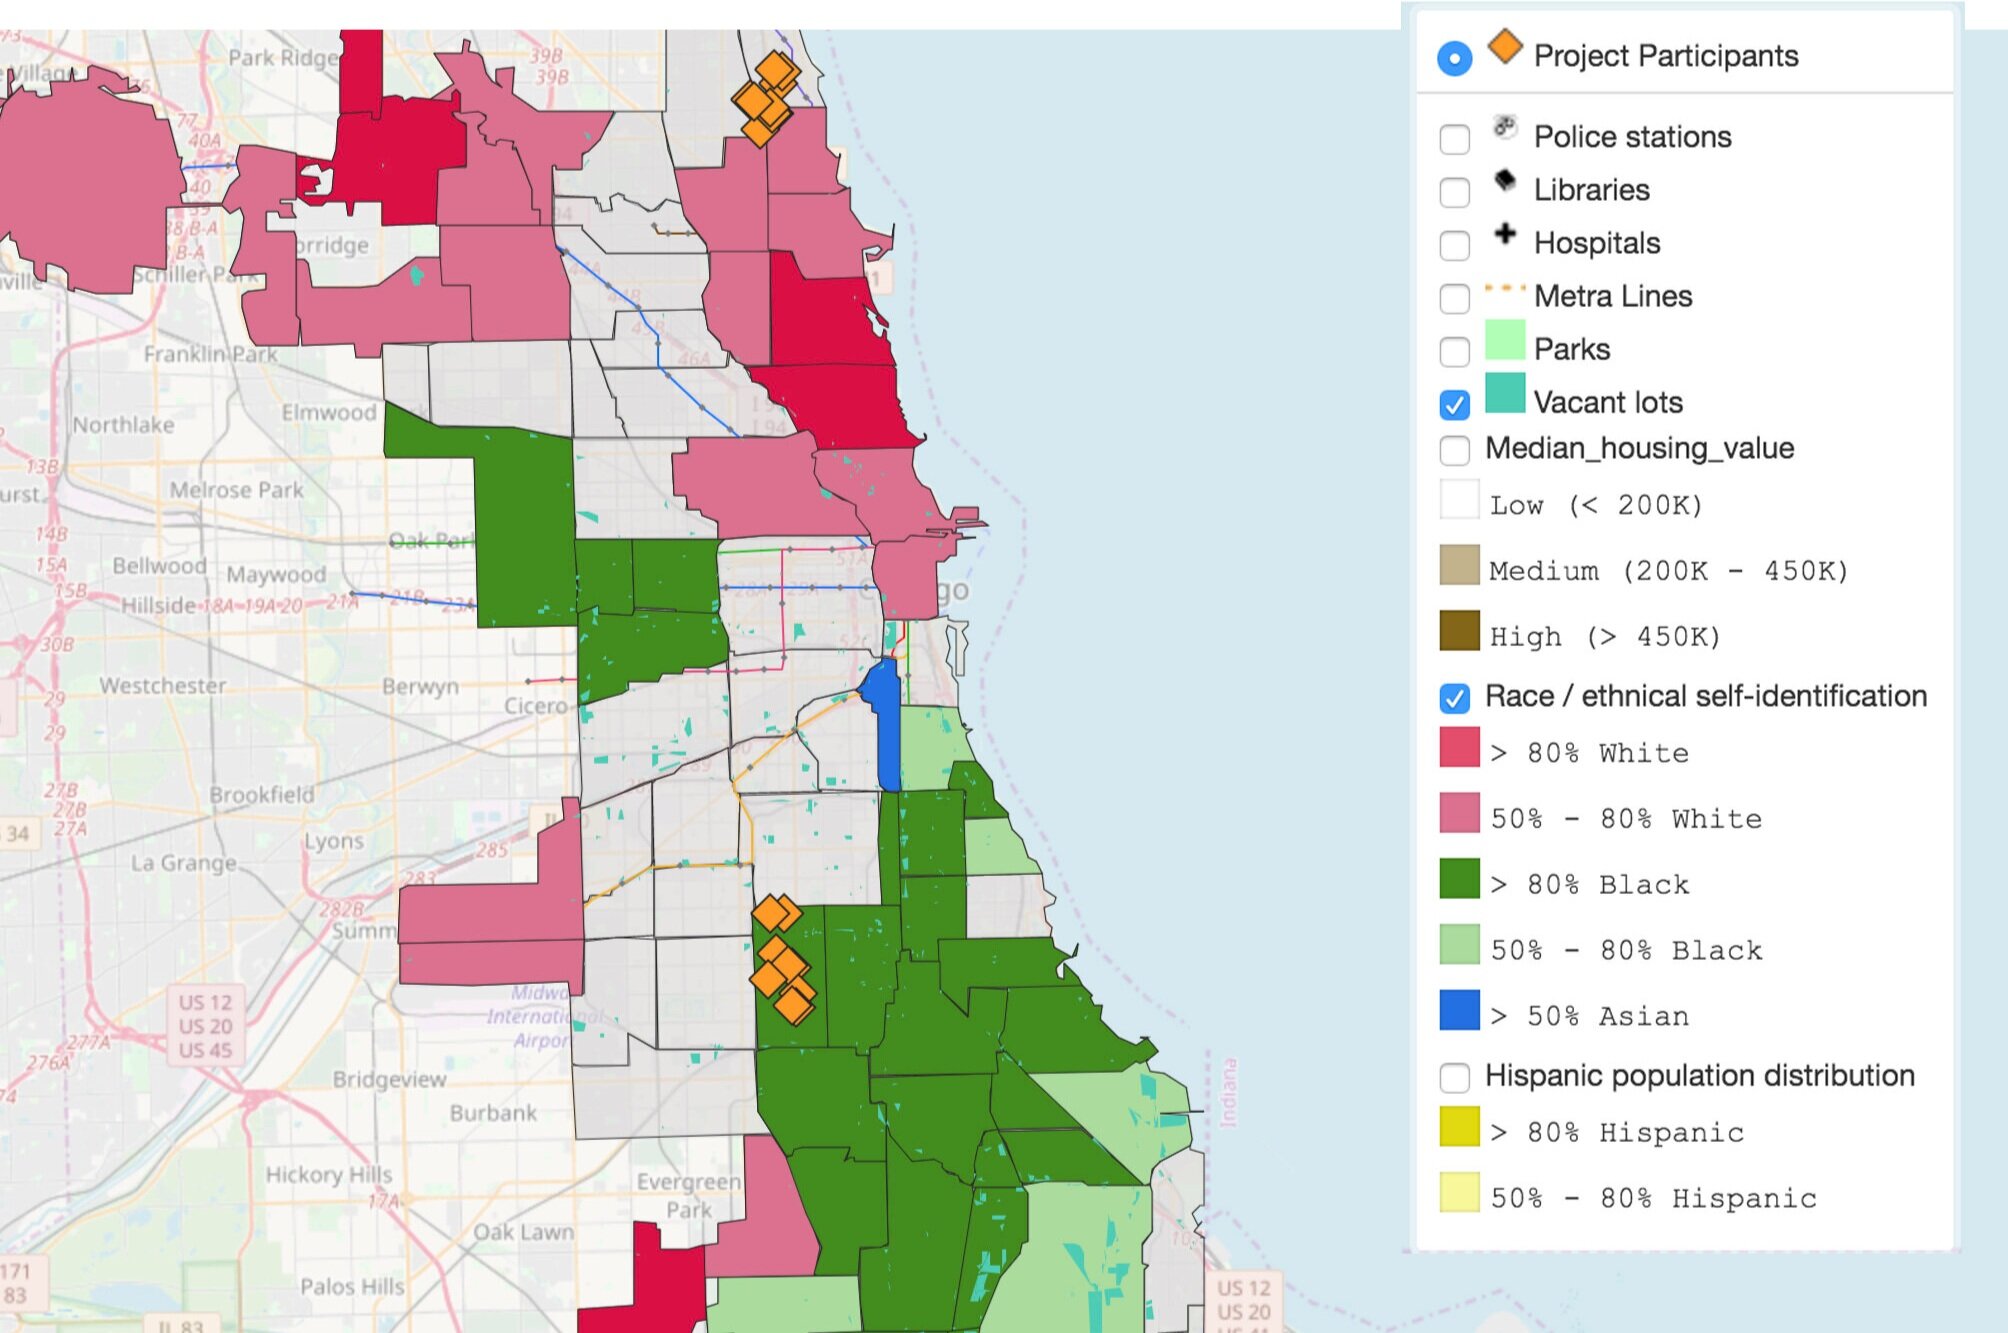
Social Characteristics Map
Explore some basic information about the Map Twin neighborhoods. See the stark segregation and vastly different housing values for neighborhoods just miles apart—does this surprise you? Dig a little deeper and find other kinds of differences—check out where the train lines go, who has easier access to hospitals, and which communities are overrun with vacant lots.

Business Map
Using this map, toggle around and ask yourself what your experience would be like in each of these neighborhoods. How hard would it be to find a place for a nice dinner at a restaurant or if you needed to get your pet to the vet? How about a quick run to the store to get food for dinner? How easy is it to find a gym to keep up with your fitness routine?

Schools Map